An app from the urbanOS ecosystem

Your city has a pulse.Now you can see it.

CityPulse counts visitors in public spaces with radio sensors — camera-free and deduplicated across whole areas. Read the live pulse, forecast the days ahead, compare any two weeks, and export every number to your own tools.

Opens the demo environment — simulated data for Cologne, no account needed.

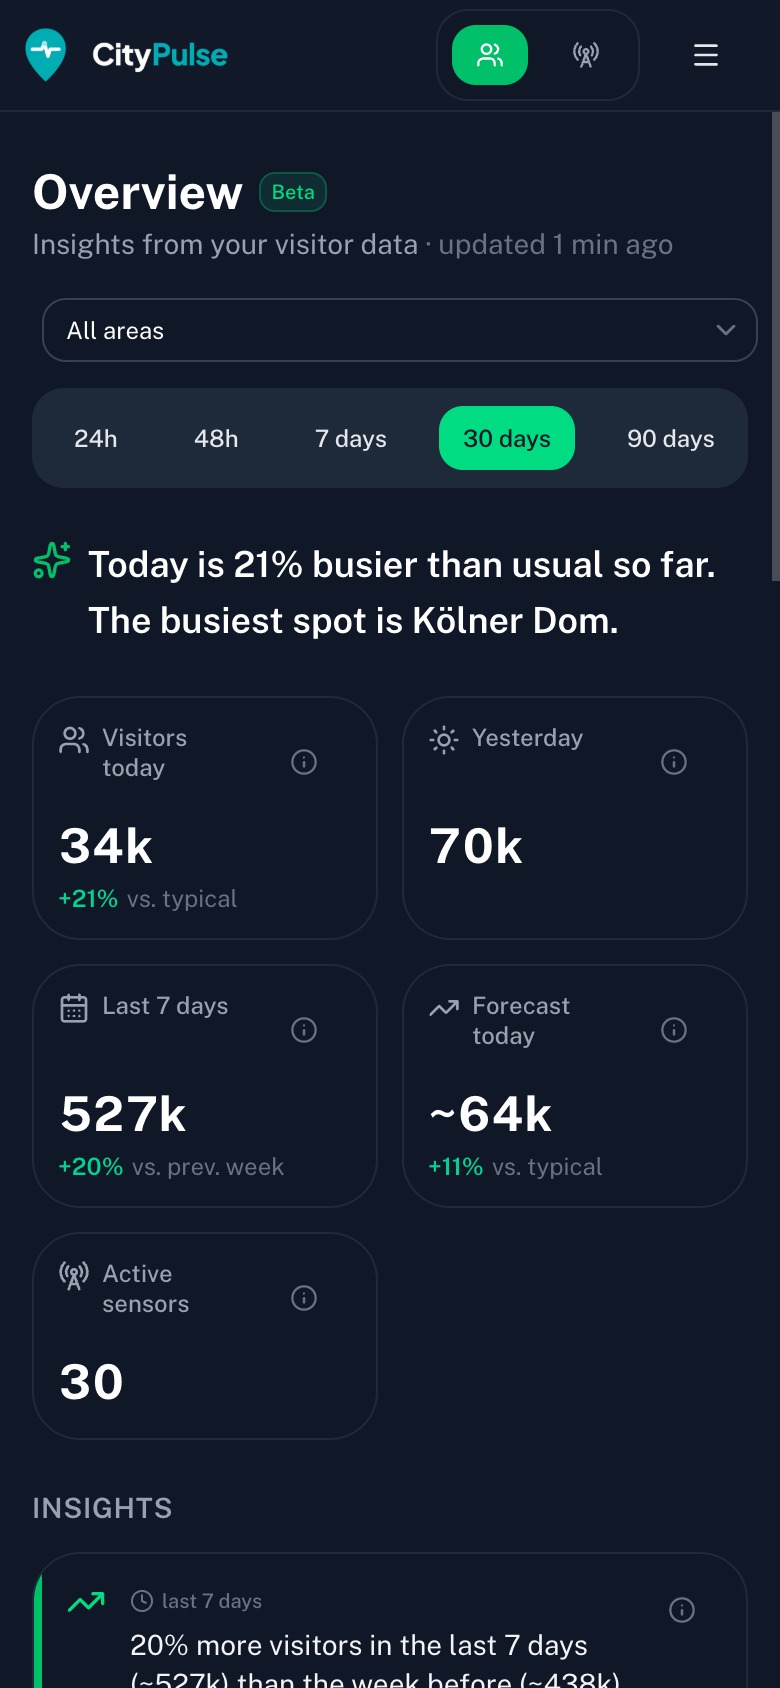
The CityPulse overview: live visitor KPIs, an automatic insight feed and a visitor forecast for a city centre

CityPulse is the visitor-analytics app of the urbanOS ecosystem: radio sensors measure presence and movement in public spaces, and anonymised radio signals from nearby mobile devices become robust visitor estimates, walking paths and heatmaps — read live, forecast for the days ahead, compared across any two timeframes and exported straight to your own tools.

Why it matters

Footfall is economic development.

Sidewalks are a means to an end what counts is business opportunity. Once you know how many people pass an address, you can market vacant units on purpose and prove the effect of your measures instead of claiming it.

Re-let vacant units faster

Every empty unit has a footfall profile — it just has never been on paper. CityPulse shows in black and white how many people pass an address each day. That is the strongest argument economic developers and landlords can hand a prospect — and where high footfall is on record, space lets faster.

Actually evaluate mobility concepts

Traffic calming, a new pedestrian zone, redirected routes: CityPulse measures footfall before and after — always with the same method. So you can see whether a measure truly brought the centre to life, instead of hoping it did.

Retail promotion with proof of impact

Discretionary funds, promotion weeks, city marketing: instead of guessing whether a campaign brings people into town, you measure the change in footfall. Impact you can prove to committees and grant bodies.

The pulse

One visitor, five counts, one visit.

Every sensor a visitor walks past counts them again — sum it up naively and one person becomes five. CityPulse follows anonymised signal paths across all sensors in an area and removes the double counting. The result is a smart estimate, and it says so openly — no false precision.

And because the method never changes, the numbers are at their strongest in comparisons: this Saturday against the last one, market day against a normal day, this year's festival against last year's.

  • More accurate than light-barrier counters in field tests
  • Within 5–20% of manual reference counts
  • Consistent method — ideal for comparing days, weeks and events

In the app, every estimate openly shows its naive sum and the overcounting factor it removed.

One visitor walks through the area
Naive sensor sum5 countsCityPulse1 visit
How the estimate is madeSignal-path deduplication · device-to-person factor · noise floor deducted
Watch · 45 seconds

See the pulse move.

Forty-five seconds through CityPulse: live footfall on one map, the naive sensor sum collapsing to honest visits, and the movement flows behind it — the very same app your city would run.

  • Live footfall on one map
  • Naive sum → honest visits
  • Flows, hotspots and events
Open the live demo

Runs 45 seconds. Sound optional — every figure is captioned on screen.

New in CityPulse

One app, the whole picture.

Every screenshot is the real product, straight from the demo you can open yourself — from the automatic insight feed to the documented export API.

CityPulse overview dashboard with visitor KPIs, an automatic insight feed and a visitor trend chartCityPulse forecast panel with per-day visitor estimates, weather and an event-impact breakdownCityPulse loudness view with the loudest place in decibels and a disproportionate-noise metricCityPulse statistics with a comparison period, per-sensor hourly values and a loudness chartThe CityPulse Export API reference showing endpoints, authentication and response formats

Your city, already read for you.

The overview turns raw counts into plain sentences: how today stands against a typical day, which spot is busiest, new records, unusual hours and the measured impact of an event — an automatic insight feed that updates as the data arrives.

Automatic insight feedRecords & anomaliesEvent impact
CityPulse overview dashboard with visitor KPIs, an automatic insight feed and a visitor trend chart

Know tomorrow before it arrives.

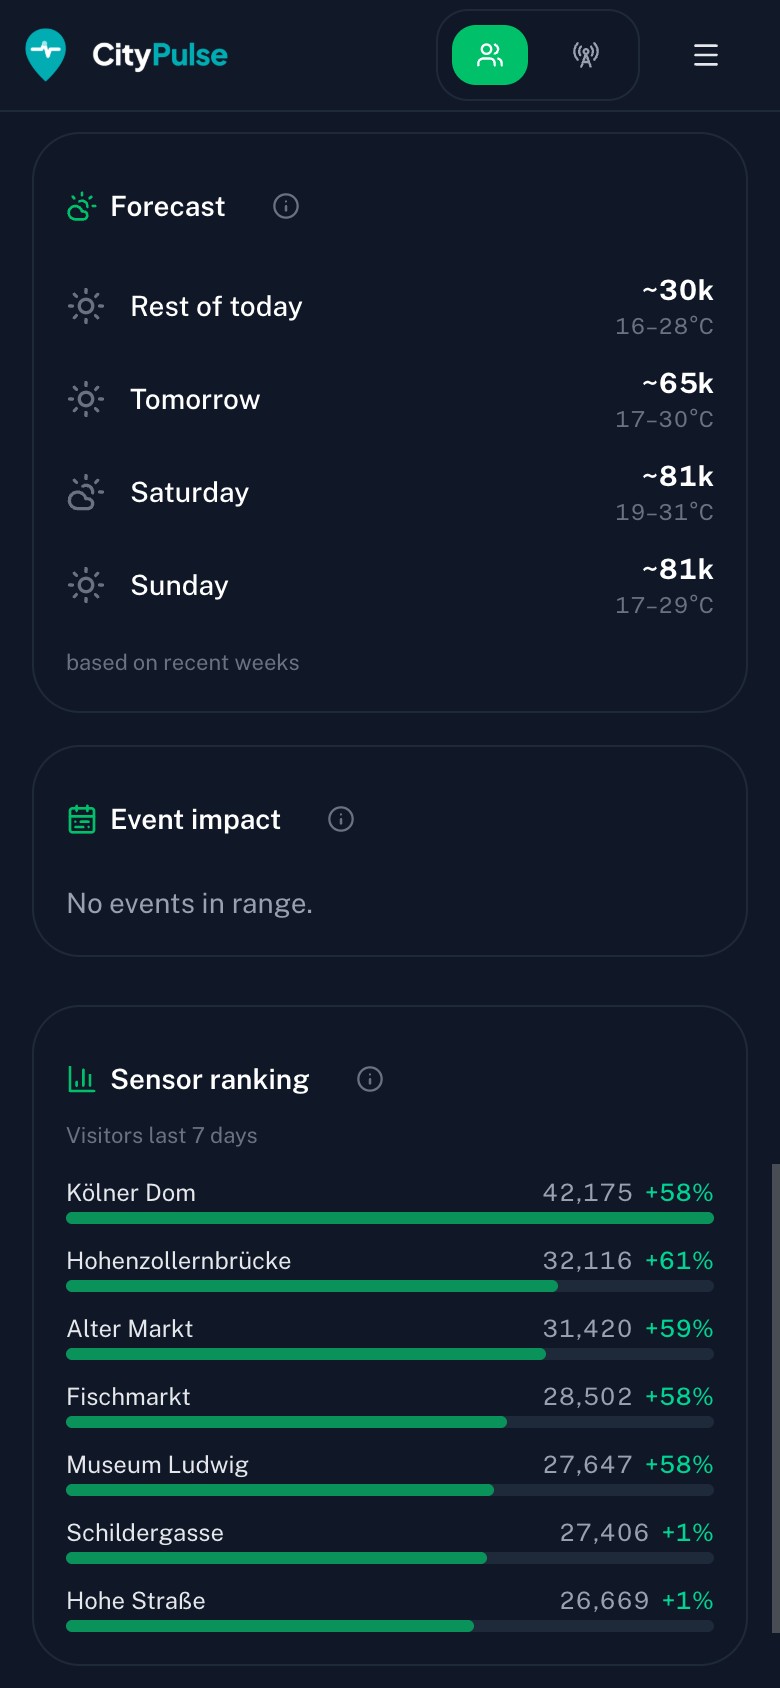
CityPulse forecasts the days ahead by combining each area's typical rhythm with the weather and the events on the calendar — so teams can plan staffing, cleaning and safety around the numbers, not a hunch.

Days-ahead forecastWeather-awareEvent-aware
CityPulse forecast panel with per-day visitor estimates, weather and an event-impact breakdown

Hear where it gets loud.

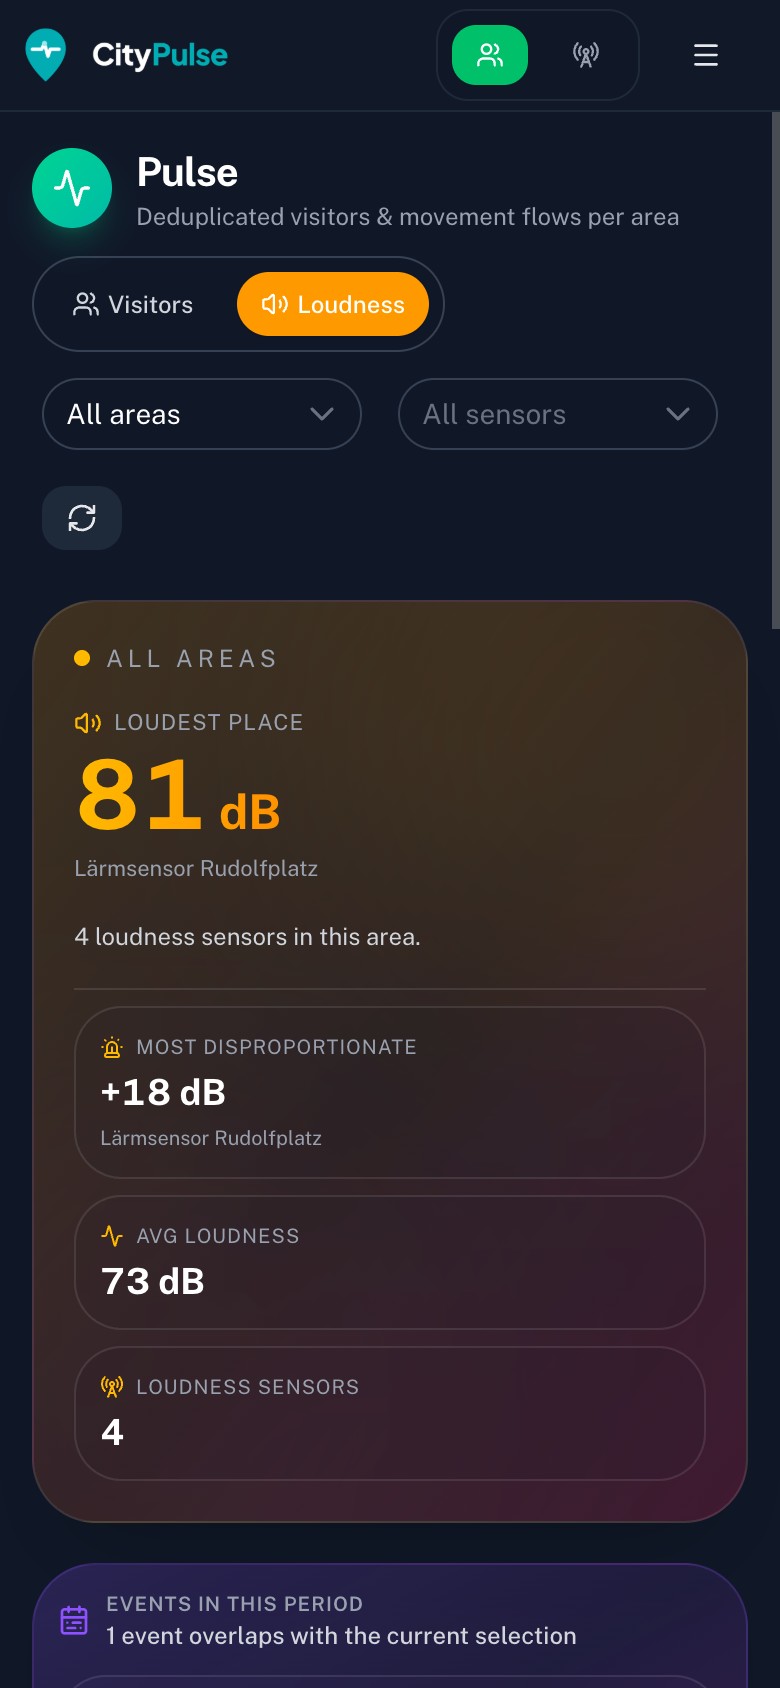
Paired loudness sensors add a decibel layer to the map. CityPulse flags the places that are louder than their crowd size would explain — an early signal for noise complaints, event acoustics and quality of stay.

Loudness sensorsLouder than the crowdOn the map & in Pulse
CityPulse loudness view with the loudest place in decibels and a disproportionate-noise metric

Compare any two timeframes.

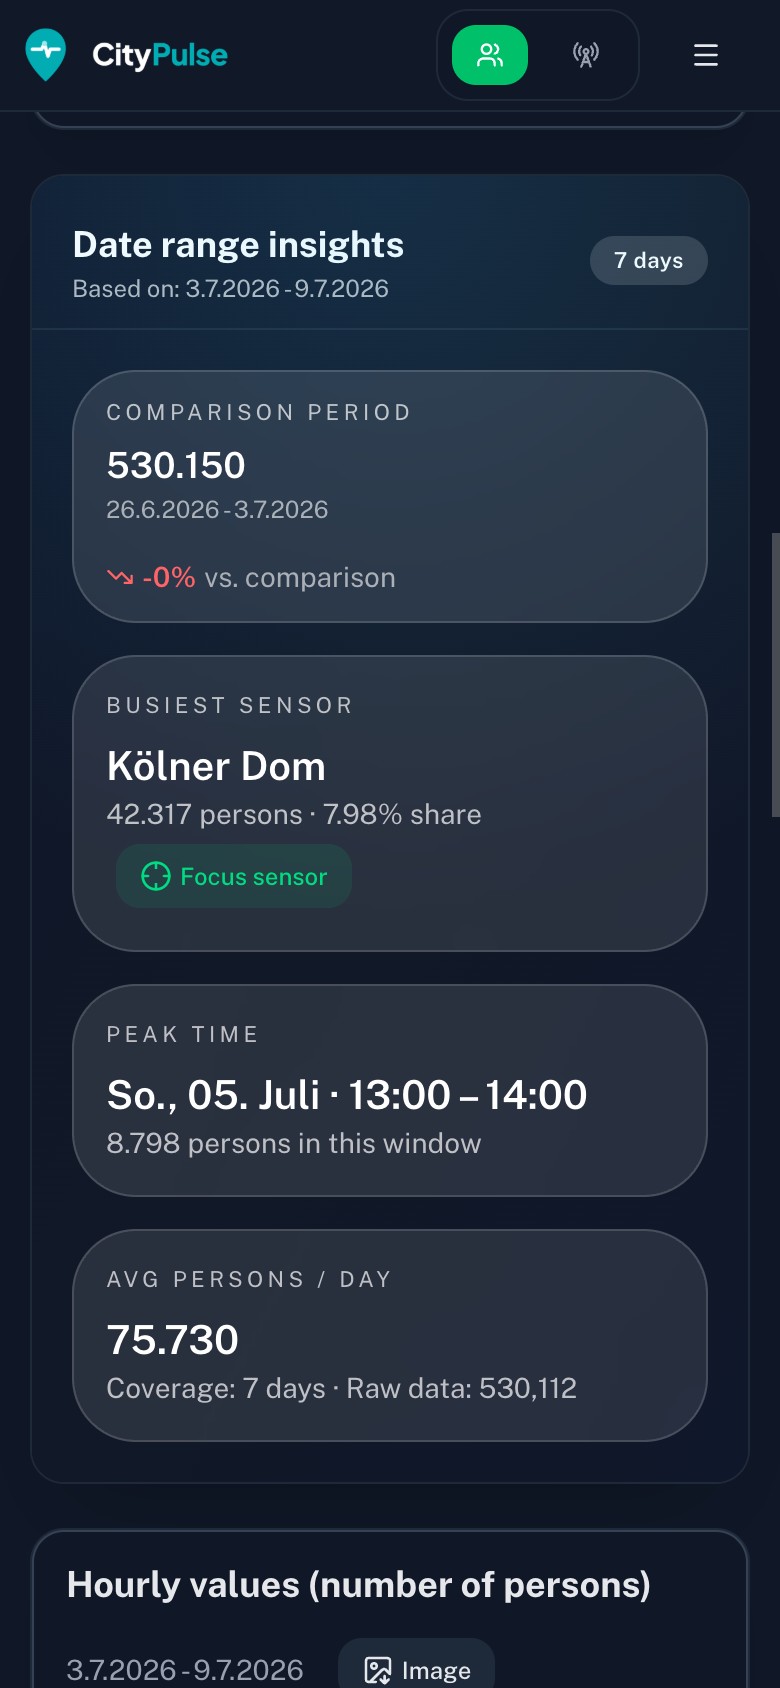
This week against last, market day against a normal day, this year's festival against last year's — with hourly detail per sensor. The method is identical every time, so a difference you see is a difference that happened.

Timeframe comparisonHourly values per sensorEvents overlaid
CityPulse statistics with a comparison period, per-sensor hourly values and a loudness chart

Every number leaves with you.

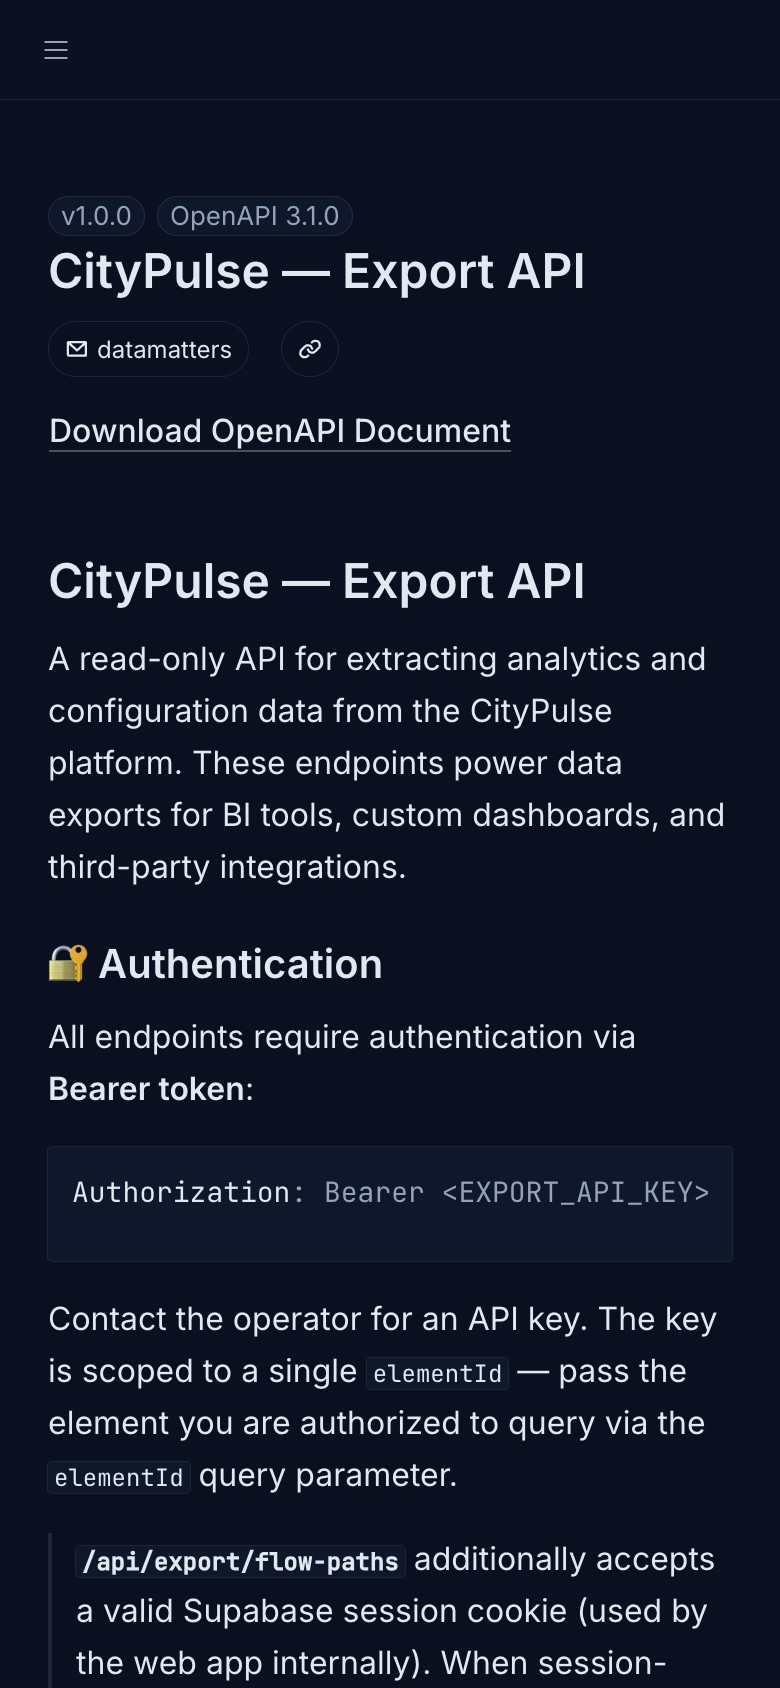
Download any view as CSV, or connect your BI tools to the read-only export API — documented in OpenAPI, authenticated by key. The data is yours, and it stays that way.

CSV exportRead-only export APIOpenAPI documented
The CityPulse Export API reference showing endpoints, authentication and response formats
One map, three questions

Now, typically, and how they move.

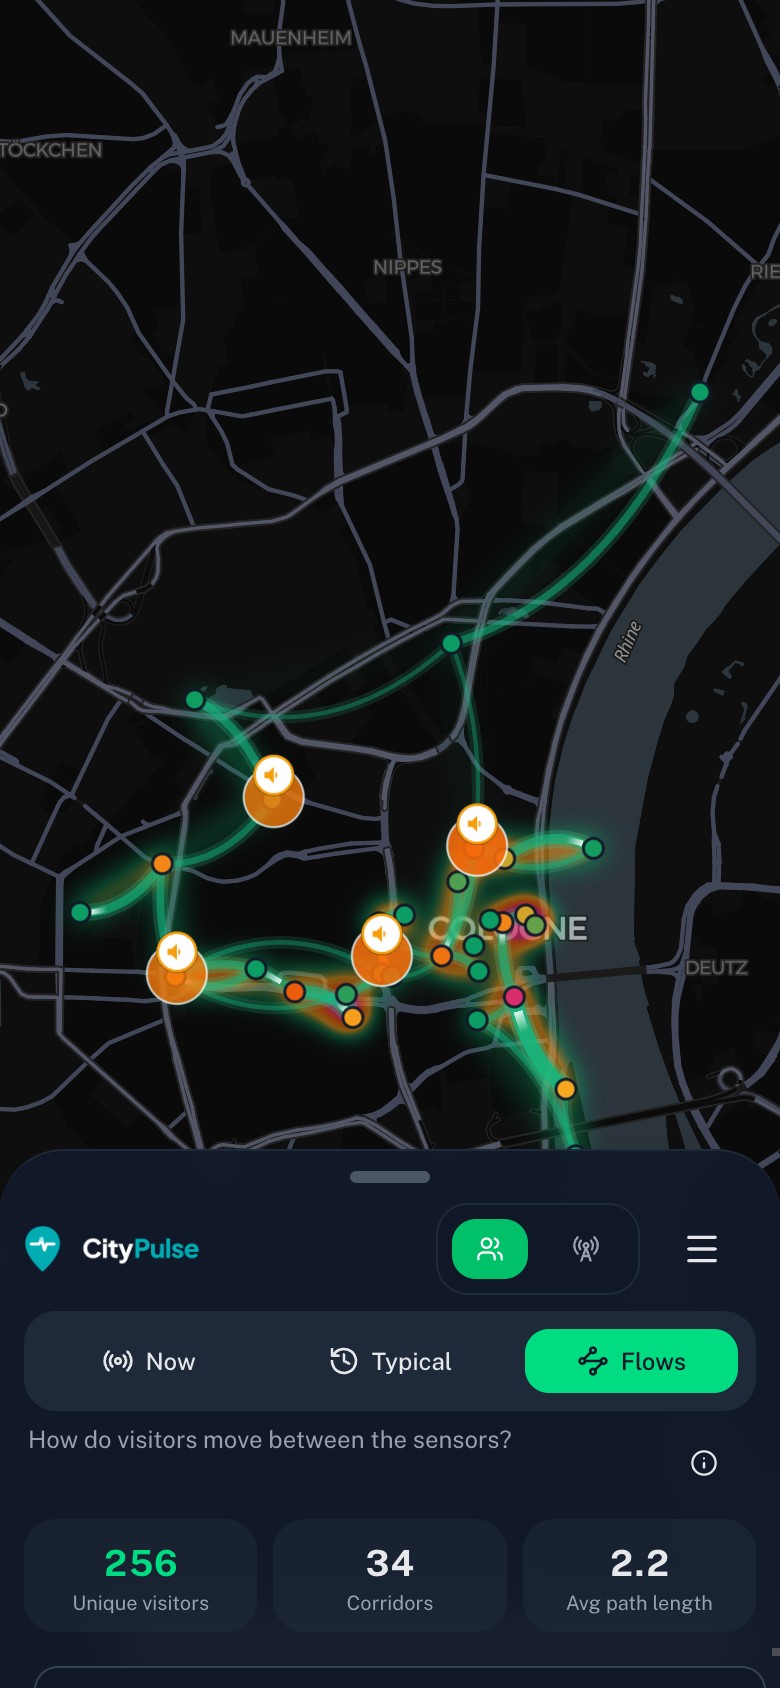
The same city centre, read three ways — from who is here this minute to the corridors visitors follow between sensors. In flat 2D or a tilted 3D view.

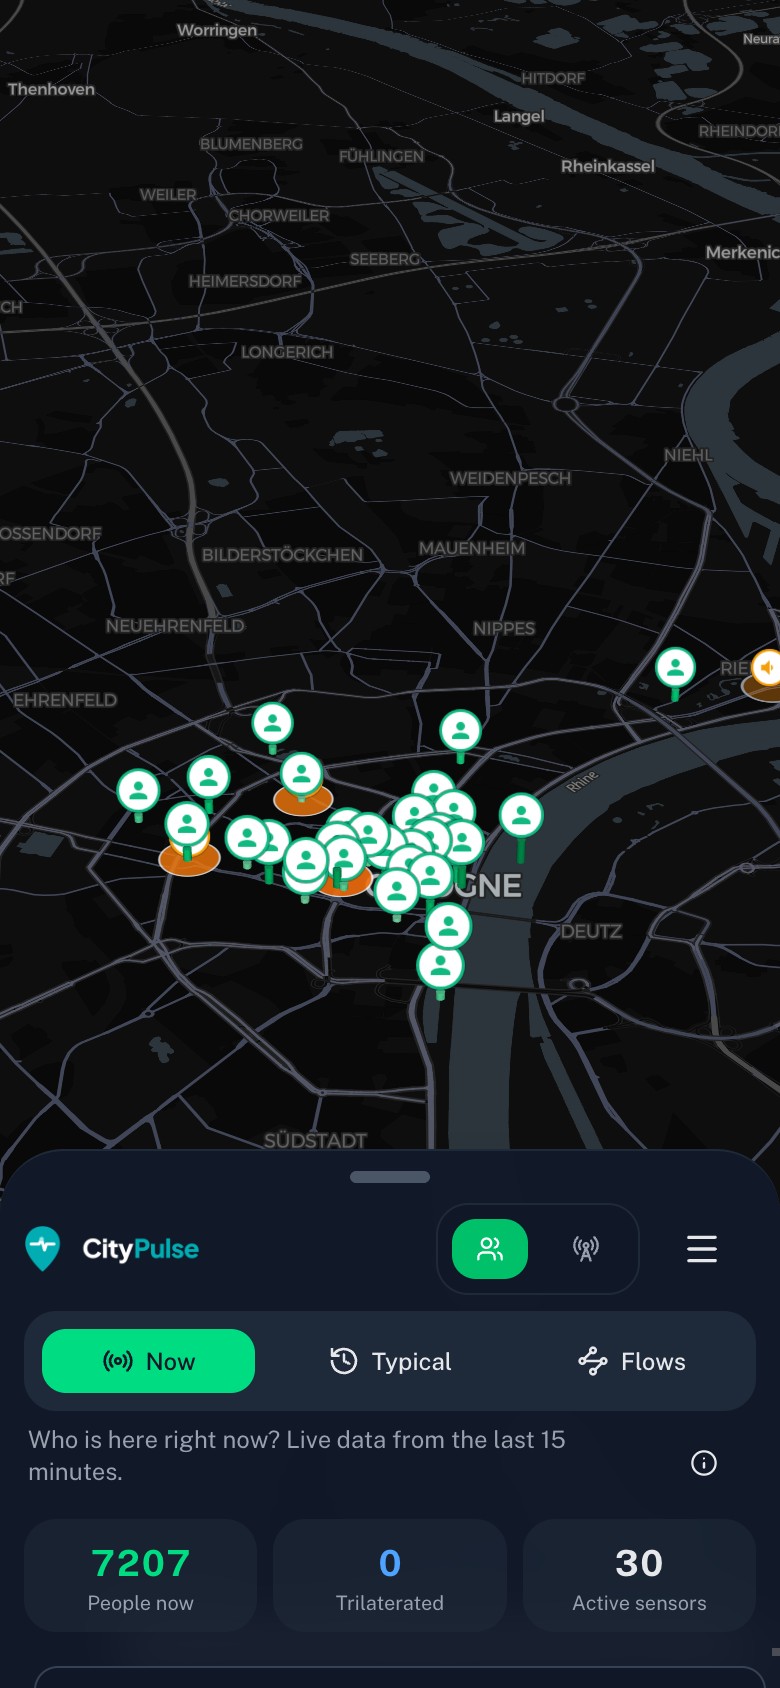
CityPulse 3D live map of Cologne with visitor pins across the old town and the Rhine
The live map — the whole city at a glance
CityPulse 3D live map of Cologne with visitor pins clustered around the old town and the Rhine
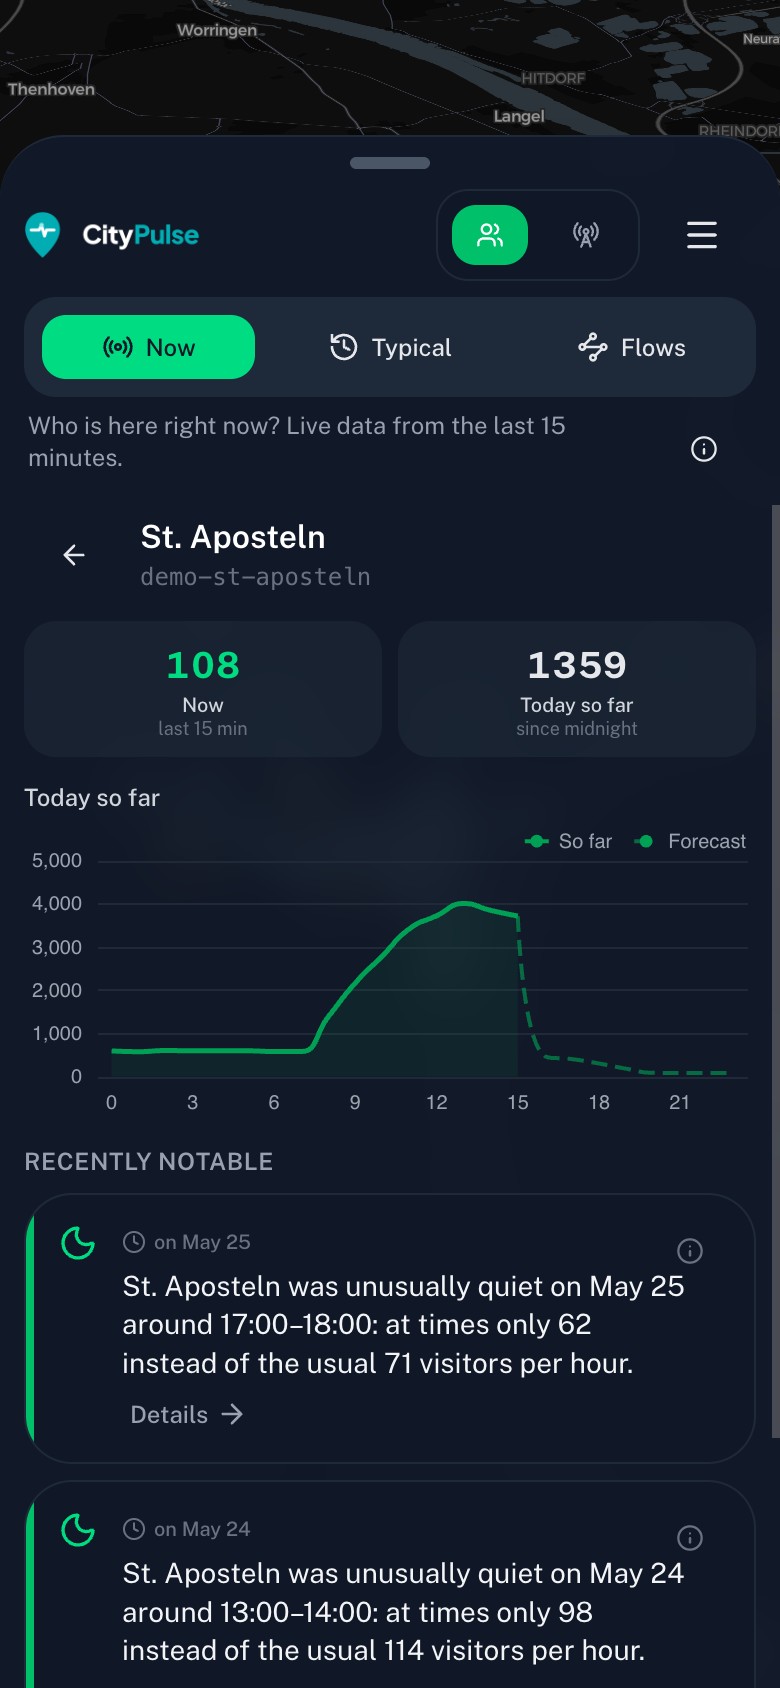
Now — who is here this minute
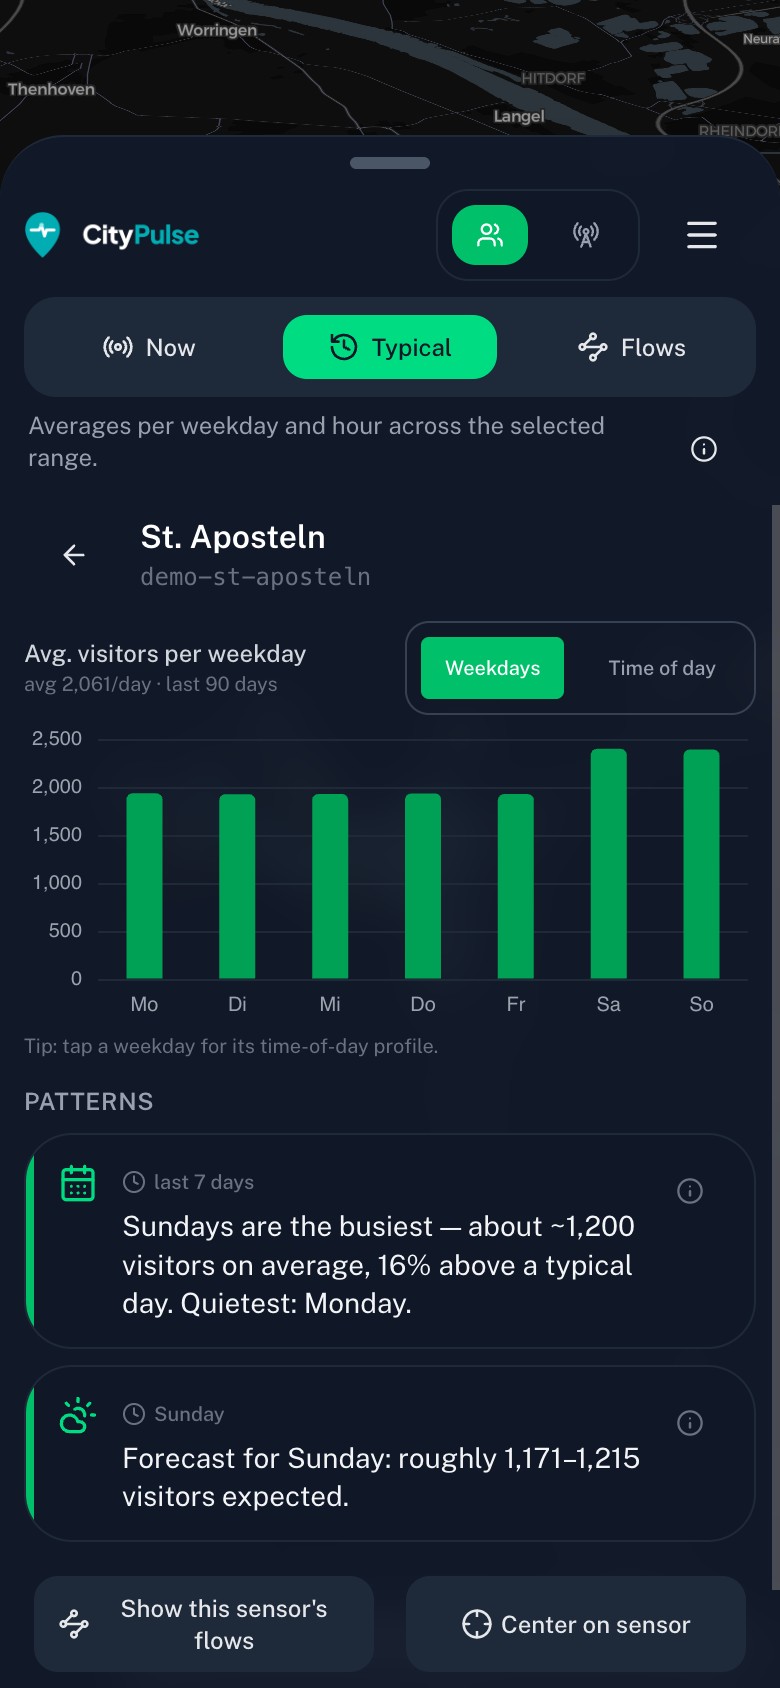
CityPulse map in typical mode with a time-of-day slider and weekday selector
Typical — any weekday and hour
CityPulse flow map with glowing corridors and a density heatmap across the city centre
Flows — corridors and journeys
Built to be trusted

Honest numbers by design.

CityPulse explains every figure directly in the app — including what it can and cannot know.

Camera-free

Radio sensors count radio signals, not faces. No images, no profiles — presence is measured as anonymised radio signals from mobile devices.

Devices → people

Not everyone carries a broadcasting device — and some carry three. A configurable per-sensor factor turns device counts into realistic person estimates.

Noise floor deducted

Parked cars, smart TVs, door counters: stationary signals are measured per sensor and subtracted, so quiet hours read as quiet.

0cameras, ever — presence is radio, not faces
5minlive refresh, straight from the sensors
5–20%typical spread vs. manual reference counts
100%of estimates show their naive sum and factor

In the app, every estimate openly shows its naive sum and the overcounting factor it removed.
Runs on the Urban Data Platform.

Every urbanOS app inherits the platform underneath it. You never buy an island.

Sovereign by default

GDPR-compliant, ISO-certified, hosted in Germany. Your city's data stays your city's data.

Live in days

Standard IoT sensors over LoRaWAN and existing networks. Deployment takes days, not months.

Grows with you

Add or remove apps as your city's needs change. The platform and your data stay in place.

Getting started

Start with a demo kit.

A complete pilot setup for nine months — sensors, gateway, app and support in one package. So you see the pulse of your own city centre, not just a demo's.

In the package
  • 1× LoRaWAN gateway for 9 months, incl. installation
  • 1× CityPulse app for 9 months
  • 6× sensors, incl. installation
  • Support for the entire term
€14,500net · price applies to Germany, other regions on requestRequest a demo kit

Click through it yourself — right now.

The open demo runs on simulated data for Cologne's old town: the insight feed and forecast, the live 2D and 3D map, visitor flows, loudness and full statistics. No account needed — it is the same app our cities use.

Open the live demo

Prefer a guided tour? Book a live session

CityPulse, explained by your AI

Let the AI you trust walk you through CityPulse and its concrete value for your municipality — tailored to your role and your city.

Opens your AI in a new tab with a prepared question. You can edit it before sending.